Learning Objectives:
The purpose of this set of exercises is to start interacting with the graphics elements that we draw using input devices. You will make a small 2D drawing program where primitive shapes of different colors can be added using the mouse. Although it is possible to draw 2D shapes using a 2D canvas context, you will do it with a WebGL context as it is really not much harder, and WebGL enables later extension to full 3D.
Deliverables:
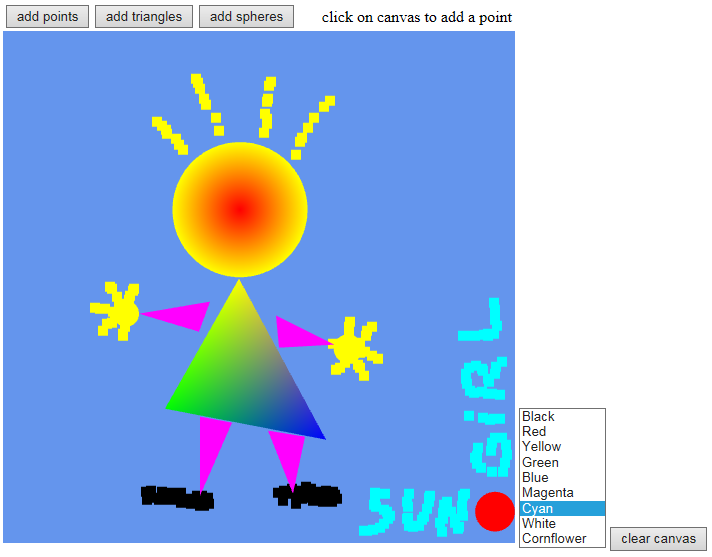
The following screenshot is an example of what the final web application could look like. Your version doesn’t have to be exactly like it. The important point is that it has the features we want.
Tasks:
For this task we are asked to attach an event handler that will listen to the mouse click event and will then draw a point at the location of the mouse. First we can start of with the canvas and shaders from Part 2 of Lab 1. Reminder that we are using jQuery for the most part instead of JavaScript but the code will look very similar. Here we can start of by getting rid of the 3 points that are already on screen and setting up the canvas so that there are is limits on how many triangles and how many vertices (or points) can be on the canvas at once. Using this limit we can now keep a tracker (index) on what point to render when clicking on the canvas. We also want the render function to be called automatically so that the new points are rendered. The code:
    const MAX_TRIANGLES = 200;
    const MAX_VERTICES = 3 * MAX_TRIANGLES;

    var index = 0;

    var vBuffer = gl.createBuffer();
    gl.bindBuffer(gl.ARRAY_BUFFER, vBuffer);
    gl.bufferData(gl.ARRAY_BUFFER, 8 * MAX_VERTICES, gl.STATIC_DRAW);

   render();
   function render() {
        gl.clear(gl.COLOR_BUFFER_BIT);
        gl.drawArrays(gl.POINTS, 0, index);
      }
As for the event handler of the mouse it is called whenever the mouse has clicked the canvas. Here we take the coordinates of where the click event occurred and use the following formula to calculate the coordinates of the vector for WebGL to render:
$$ x = -1+\frac{2x_w}{w}\qquad y = -1+\frac{2(w - y_w)}{w} $$
We use this inside the new even handler and the method bufferSubData which will draw the indicated
data from the data registers starting at the offset specified. The offset in our case will be the size of a
vec2 which is a byte multiplied by what index of vertex it is which we had set up above. So our
code will be:
// Mouse on click event
    $("#gl-canvas-1").click(function (event) {
        var t = vec2(-1 + 2 * event.clientX / canvas.width,
            -1 + 2 * (canvas.height - event.clientY) / canvas.height);

        gl.bindBuffer(gl.ARRAY_BUFFER, vBuffer);
        gl.bufferSubData(gl.ARRAY_BUFFER, 8 * index, flatten(t));

        index++;

        render();
    });
Testing our function we notice that the points are being drawn to the canvas however, they are being offset by the location of the canvas on the screen. Since our canvas is centered on the page if our screen is larger than the size of the canvas the formula will not take into consideration the offset of the canvas being in the middle of the screen. To take the offset into account we need the position of the left border of the canvas and the top border of the canvas. Using the border we can then subtract the borders from the click event coordinates as such:
var a = [-1 + ((event.clientX - cRectangle.left) / canvas.width) * 2,
        (-1 + ((event.clientY - cRectangle.top) / canvas.height) * 2) * -1
        ];
cRectangle is the canvas rectangle returned by the getBoundingClientRect method of the
canvas. This method allows us to get the position of the canvas relative to the viewport. Our canvas is now
working as intended and drawing points where it was clicked. The canvas also supports drawing by holding down
the mouse, it will stop drawing when the mouse is let go.
This part introduces the different ways that HTML input elements can be used to interact with WebGL using JavaScript. In this first task we can implement the use of a button to clear the screen. This is done by adding a button HTML element to the DOM. We decide to place this clear button underneath the canvas so adding this HTML code after our canvas code will do that:
<button id="clr-canvas-2">Clear Canvas</button>
We can now use this button in our JavaScript code so that when it is clicked it calls the clear
method on our WebGL context.
$("#clr-canvas-2").click(function (e) {
        e.preventDefault();
        gl.clear(gl.COLOR_BUFFER_BIT);
    });
Our button is now clearing the canvas however it would be nicer if we could choose the color in which the canvas
is clear to. To do this we introduce the other HTML element of select and option .
These are basically a dropdown menu in where option is the different list items inside the dropdown
menu and the select is the container for the options. We can add a label to the select
to prompt the user to change the color. The HTML code for our dropdown menu is shown below:
<div class="container-colorSelection">

            <label for="colors-clear">Clear color selected:</label>

            <div class="color-preview" id="cp-clear"></div>

            <select name="colors-clear" id="colors-clear">
                <option value="black">Black</option>
                <option value="red">Red</option>
                <option value="yellow">Yellow</option>
                <option value="green">Green</option>
                <option value="blue">Blue</option>
                <option value="magenta">Magenta</option>
                <option value="cyan">Cyan</option>
            </select>
</div>
Note that here we place our dropdown menu along with the label and a small preview of the color inside it's own container. This is simply due to formatting of the webpage. The same as with the button, now that we have our HTML object we can now use it inside our JavaScript code. To select the color we will be using an array of vectors (or a matrix) containing the color values as seen below:
var colors = [
    vec4(0.0, 0.0, 0.0, 1.0),  // black
    vec4(1.0, 0.0, 0.0, 1.0),  // red
    vec4(1.0, 1.0, 0.0, 1.0),  // yellow
    vec4(0.0, 1.0, 0.0, 1.0),  // green
    vec4(0.0, 0.0, 1.0, 1.0),  // blue
    vec4(1.0, 0.0, 1.0, 1.0),  // magenta
    vec4(0.0, 1.0, 1.0, 1.0)   // cyan
];
Using this matrix we can change the value of the selected color with a variable that indicates which index of the color matrix to use (i.e. red will be 1). To do this we will get the index of the dropdown options that have been selected whenever there has been a change in selection as seen below:
 $("#colors-clear").change(function (e) {
        e.preventDefault();
        $("#cp-clear").css("background-color", $("#colors-clear option:selected").text());
        color_selected_clear = $("#colors-clear").prop('selectedIndex');
    });
Inside our click function for the clear button we can then simply add the clearColor method right
before clearing the canvas as seen below:
    $("#clr-canvas-2").click(function (e) {
        e.preventDefault();

      gl.clearColor(colors[color_selected_clear][0],
      colors[color_selected_clear][1],
      colors[color_selected_clear][2],
      colors[color_selected_clear][3]);


        gl.clear(gl.COLOR_BUFFER_BIT);
    });
Now that our button is clearing the canvas to the selected color by the user, we can do the same but for drawing
by using what we learned in, Lab 1 Part 3, in using a color buffer. We can create
our color buffer in a similar way to how we did in the previous lab however, now we must make the data size
variable using our MAX_VERTICES variable from the previous task. The code for our buffer creation
and association is seen below:
    const colorBuffer = gl.createBuffer();
    gl.bindBuffer(gl.ARRAY_BUFFER, colorBuffer);
    gl.bufferData(gl.ARRAY_BUFFER, 16 * MAX_VERTICES, gl.STATIC_DRAW);

    var vColor = gl.getAttribLocation(program, "vColor");
    gl.vertexAttribPointer(vColor, 4, gl.FLOAT, false, 0, 0);
    gl.enableVertexAttribArray(vColor);
We can then take the code from Lab 2 Part 1 while changing the
mouseDown event so that it also buffers the color data of the currently selected draw color which
we have implemented in the same manner as our clear color selection process. The code can be seen below for the
mouseDown event:
 var cRectangle = canvas.getBoundingClientRect();

 var vClick = [-1 + ((mouseX - cRectangle.left) / canvas.width) * 2,
        (-1 + ((mouseY - cRectangle.top) / canvas.height) * 2) * -1
        ];

        // Buffer the point data
        gl.bindBuffer(gl.ARRAY_BUFFER, positionBuffer);
        gl.bufferSubData(gl.ARRAY_BUFFER, 8 * index, flatten(vClick));

        // Buffer the color data
        gl.bindBuffer(gl.ARRAY_BUFFER, colorBuffer);
        t = vec4(colors[color_selected_draw]);
        gl.bufferSubData(gl.ARRAY_BUFFER, 16 * index, flatten(t));

        index++;

        render();
It is worth noting that our clear button function can now reset which data is
    being rendered to the screen by setting the index back to 0.
For this part we will start from scratch and then combine all the parts in Lab 2 Part 4. This task entails the addition of a drawing mode. Before we get started we take all the code from Part 3 but without any of the color selection modes nor the clear button. The basis of the HTML code for part 3 will be simple with the alteration of one of the dropdown menus and the deletion of the other. The altered dropdown menu will be used to select the drawing style. The HTML code for part 3 can be seen below:
<div class="container-drawModeSelection">
        <label for="draw-mode-3">Draw mode selected:</label>

        <div class="icons">
            <i class="fas fa-mouse-pointer"></i>
        </div>

        <select name="draw-mode-3" id="draw-mode-3">
            <option value="points">Points</option>
            <option value="triangles">Triangles</option>
            <option value="circles">Circles</option>
        </select>
    </div>

    <canvas id="gl-canvas-3" width="512" height="512">
        Sorry; your web browser does not support HTML5’s canvas element.
    </canvas>
Using the new dropdown menu we can now use the same array principle as before but now just having a object that hold a set of Booleans that dictate which mode is turned on, this can be seen in the code below:
var drawMode = {
    point: true,
    triangle: false,
    circle: false
};

 $("#draw-mode-3").change(function (e) {
        e.preventDefault();

        switch ($("#draw-mode-3 option:selected").text()) {

            case "Points":
                drawMode.point = true;
                drawMode.paint = false;
                drawMode.triangle = false;
                drawMode.circle = false;
                break;

            case "Paint":
                drawMode.point = false;
                drawMode.paint = true;
                drawMode.triangle = false;
                drawMode.circle = false;
                break;

            case "Triangles":
                drawMode.point = false;
                drawMode.paint = false;
                drawMode.triangle = true;
                drawMode.circle = false;
                break;

            case "Circles":
                drawMode.point = false;
                drawMode.paint = false;
                drawMode.triangle = false;
                drawMode.circle = true;
                break;

            default:
                alert("Error when choosing Draw Mode!");
                break;
        }
    });
This will let the program know what mode the user has currently selected. Here we also added a
Circles drawing mode because it is required in the next part so might as well add it now , we
also
add a draw mode of paint which uses the code from Part 1 addition of the holding down the mouse to draw
points.
Now that our program can determine what mode to draw in we need to implement a way in our
render
method so that our drawArrays method is using the correct render format. The initial thought
would
be to simply change the render format from POINTS to TRIANGLES depending on the
draw
mode that is selected, however, this would replace all the previously drawn data. We would like to implement
a
solution that does not replace the previous rendered data points. To do this we can make the
render
method only render the indices of the points vertices using the POINTS format and the indices
of
the triangle vertices using the TRIANGLES format. The render method will therefore
look like the following:
function render() {
        gl.clear(gl.COLOR_BUFFER_BIT);

        for (var i = 0; i < index; i++) {
            if (pointIndices.includes(i)) {
                gl.drawArrays(gl.POINTS, i, 1);
            } else if (triangleIndices.includes(i)) {
                gl.drawArrays(gl.TRIANGLES, i, 3);
            }
        }
}
Here we are using two arrays to keep track of which indices are triangles and which are normal points. Since
the
TRIANGLES format will always use a set of three vertices to make a triangle we only need to
keep
track of the first vertex making up the triangle since it will use the following two vertices of that index.
Keeping this in mind we can modify our on mouse click function so that if the drawing mode is triangle every
three points will remove two points from the pointIndices array, adding the oldest added vertex
to
be the starting vertex index for drawing the triangle. We do not have to do anything with the third vertex
since
we are only interested in the starting vertex. As for the point vertices we want to keep track of all of
them.
The code for adding a new click position as either a point or a triangle is shown below:
if (drawMode.point) {
// Add the point to be rendered
points.push(clickPosition);

// Buffer the point data
gl.bindBuffer(gl.ARRAY_BUFFER, positionBuffer);
gl.bufferSubData(gl.ARRAY_BUFFER, 8 * (index), flatten(clickPosition));

pointIndices.push(index);

} else if (drawMode.triangle) {

// Buffer the point data
gl.bindBuffer(gl.ARRAY_BUFFER, positionBuffer);
gl.bufferSubData(gl.ARRAY_BUFFER, 8 * (index), flatten(clickPosition));

if (counter <= 2) {
    pointIndices.push(index);
    counter++;
} else {

    pointIndices.pop();
    triangleIndices.push(pointIndices.pop());

    // Reset the counter
    counter = 1;
}
During this part of the Lab all previous parts will be combined for the final result, however, they are not
discussed how they were added in detail please see Appendix for full code. Adding on from the setup we did
in
the previous part we can expand the render method to look for an additional index type of a
circle.
This render format that this new rendering will use is of type TRIANGLE_FAN where the center of
the
circle will be the initial vertex where the triangles will be formed. This will require a variable which
saves
the center point of the circle that is created with the first click as well as the creation of the vertex
surrounding this central point on the second click. Expanding our on click event manager of the mouse button
we
can add a new case to the if statement tree that checks if the draw mode is circle as stated by the user
using
the dropdown menu. Inside of the new else if statement's body we can follow what we did with adding the
triangle in that depending on which sequence of click this is it will add the vertex to the indices of
points or
we attach it to the circle. Unlike the triangle, the circle will only have two clicks needed to make the
circle,
the center of the circle will be indicated by the first click, while the second click will indicate the edge
of
the circle. As such, we require the use of a flag (Boolean) that indicates to the program that the click
made is
either the first or second in sequence. The first click will set this flag so that the next click will be
considered the second in sequence. The first click will be rendered as a normal point and thus requires
similar
code to the point draw method as seen below:
secondPointFlag = true;

 // Register the center point
 centerPoint = clickPosition;

 // Buffer the point data
 gl.bindBuffer(gl.ARRAY_BUFFER, positionBuffer);
 gl.bufferSubData(gl.ARRAY_BUFFER, 8 * (index), flatten(clickPosition));

 // Buffer the color data
 gl.bindBuffer(gl.ARRAY_BUFFER, colorBuffer);
 var color = vec4(colors[color_selected_draw]);
 gl.bufferSubData(gl.ARRAY_BUFFER, 16 * index, flatten(color));

 // Adds the center point of the circle to be rendered as a point
 pointIndices.push(index);
The second click will however need to create the vertices around the center point to the edge defined by this second click. We can define the radius of this circle created at the center point by the point distance formula from the center to the location of the second click as shown by the formula below:
$$ r = \sqrt{(click_x - center_x)^2 + (click_y - center_y)^2} $$
Using this radius we can now iterate around the perimeter of a circle by 360 degrees to create the new
vertices.
If we want less detailed polygons we can instead of use all 360 vertices to make the circle define a
CIRCLE_RESOLUTION variable that will jump a set number of degrees between each of the vertices
created. The formula that we will use to create a point around the center point is a modified version of
that
which we used in Lab 1 Part 5 once the vertex is created we simply need to
bind it to the point and color buffers while increasing the index counter. The code for the second click can
be
seen below:
if (secondPointFlag) {
   // Reset the counter
   secondPointFlag = false;


   // Stop drawing the center point
   circleIndices.push(pointIndices.pop());

   var vertices = [];

   // The first vertex is the center point
   vertices.push(centerPoint);

   var initIndex = index - 1;

   var radius = Math.sqrt(
    (clickPosition[0] - centerPoint[0])
     * (clickPosition[0] - centerPoint[0])
      +
    (clickPosition[1] - centerPoint[1])
     * (clickPosition[1] - centerPoint[1]));;

   // Loop 360 degrees to create a circle
   for (var i = 0.0; i <= 360; i = i + CIRCLE_RESOLUTION) {
       // Convert to degrees
       var j = i * Math.PI / 180;

       // Get X and Y coordinates
       var vertex = [
         ((Math.sin(j) * radius) + centerPoint[0]),
         ((Math.cos(j) * radius) + centerPoint[1]),
         // Add another dimension for 3D
     ];

     vertices.push(vertex);

     // Buffer the point data
     gl.bindBuffer(gl.ARRAY_BUFFER, positionBuffer);
     gl.bufferSubData(gl.ARRAY_BUFFER, 8 * (index), flatten(vertex));


     // Buffer the color data
     gl.bindBuffer(gl.ARRAY_BUFFER, colorBuffer);
     var color = vec4(colors[color_selected_draw]);
     gl.bufferSubData(gl.ARRAY_BUFFER, 16 * (index), flatten(color));

     index++;
    }

 // Makes the index size of the circles dynamic
 circleDataSize = index - initIndex;
Make note of the variable initeIndex which is used to track the index of the center point so
that as
the loop of the circle creation is happening the program knows how many vertices it created. Knowing how
many
vertices were created is important when rendering to specify how many vertices after the specified initial
index
should be used to create the fan of triangle making up the circle. This specification of number of indices
after
the index is referred to as the circleDataSize in the code above. We also make use of the
array.pop method to no longer render the center point using our point draw method.
Lab Finished!
Report Finished!
Report Merged!